If you’ve been tuned in to financial news over the first half of the year, you’ve undoubtedly heard and read about the stream of initial public offerings (IPOs) hitting the markets over the past few months. From ridesharing behemoths to producers of plant-based meat alternatives, the majority of these share offerings have belonged to emerging tech companies which have shown tremendous growth and now seek public investment following multiple rounds of private funding. These companies often see stratospheric returns in their initial days of public trading before cooling and returning to Earth. This post will address the recent IPO craze from our perspective and highlight why we steer clear with our investors’ capital.
Q1 of this year was slow for the IPO market, due largely to the December stock market selloff coupled with the government shutdown extending through January. However, in Q2, 62 IPOs raised over $25 billion – a 5-year record – according to Renaissance Capital data. The Renaissance IPO ETF (ticker: IPO) tracks new public offerings and gained 35.8% through the first half of the year, more than doubling the 17.4% returned by the S&P 500. While this performance is excellent, we at Altrius have avoided these hot issues, instead keeping to our disciplined strategy focused on value and income.
Growth at an Unreasonable Price
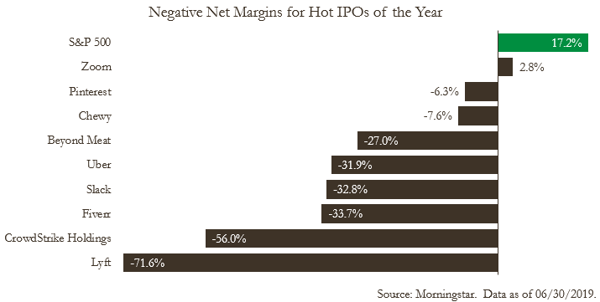
Our investment decisions are driven by value, not price, and we don’t believe the valuations of the recent cohort of public companies are justified. These companies have no earnings and many are without a likely path to profitability in the foreseeable future. As seen below, of nine of the season’s largest IPOs, only one company – Zoom Video Communications – has positive net income in the trailing twelve month period. The chart depicts net margin, calculated as net income over revenue using Morningstar data. On average, these companies lost 29.3 cents on each dollar of revenue, as compared to earnings of 17.2 cents for the broader S&P 500. Looking at net margins, the loss leader was Lyft, which lost $1.8 billion on $2.5 billion in revenue, although Uber had the greatest loss, totaling $3.8 billion on $11.8 billion in revenue.
Despite these financials, investors have piled money into these new offerings, either believing in their growth stories or simply hoping to make a quick profit by riding the wave of excitement. Assuming the former case, we question whether these astronomical valuations reflect the risks inherent to such high growth expectations. Given the absence of underlying fundamentals, do these values suggest that the correct way of evaluating companies is now based on alternative criteria to profitability and cash flow (i.e. daily active users, unique visits, etc.)? It’s possible – and even accurate to an extent, given that these metrics can signal future revenue generation – but they aren’t value drivers on their own. More important is a business model that provides a road to positive and growing profitability, which many of the newly public companies are without. Thus, these non-traditional metrics without solid fundamentals behind them them draw parallels to those touted during the dot-com era at the end of the twentieth century. The bottom line is that over the long term, prices adjust to reflect the underlying value of a company, and we are not confident that today’s inflated prices are conveying appropriate valuations.
A Bleeding Company Can’t Pay its Shareholders
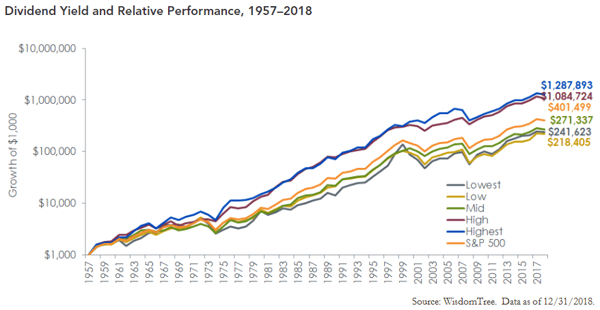
A central tenet of our investment process is a focus on dividend income. Dividends grant both material and psychological advantages to our clients by allowing them to be paid for their patience through difficult cycles, providing cash that can be redeployed at lower valuations in a downturn. The chart from WisdomTree below illustrates returns by high-dividend-paying companies soundly outpacing those of non- or low-dividend payers over the past half-century, showing that dividends also provide a significant portion of long-term returns. With no earnings, the companies discussed above certainly cannot afford to pay dividends, making them unattractive long-term investments in our eyes.
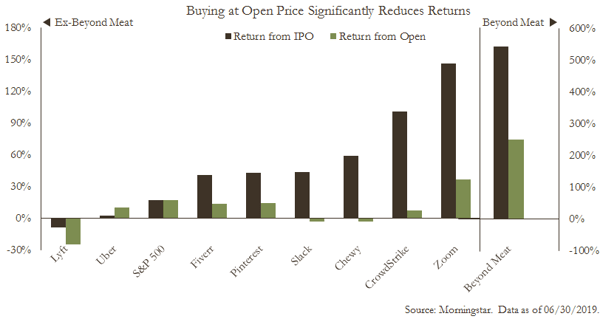
Buying an IPO is Difficult
Even if you’d like to buy an IPO issue, doing so is more difficult than it seems for a retail investor. Most IPO shares are allocated to large institutional investors, with only a small percentage – typically 10% – reserved for retail. This makes it unlikely that a retail investor can purchase IPO shares at the actual offering price, particularly in the cases of highly demanded issues such as those highlighted above. As a result, many retail investors may only purchase newly issued shares at the price at which they begin trading, which is often much higher than the price at which they were issued to IPO investors. Comparing IPO prices to open prices of the new issues highlighted above, the open was on average 47.4% higher than the IPO offering. Shown below, nearly every issue jumped over 20% immediately at its trading debut, the only exception being Uber, which actually dropped.
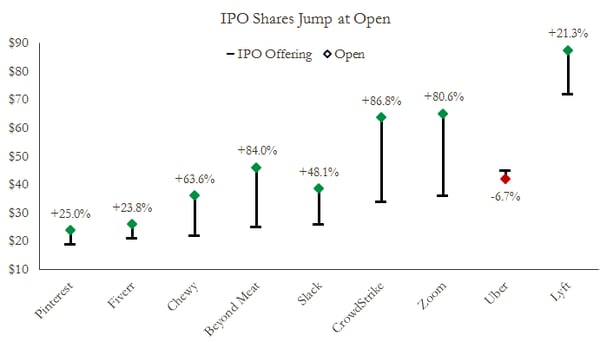
Looking at the nine hottest IPOs of the year, the average return from the IPO price was 108.1% through the first half, though the average return from the open price was only 33.6%, using data from Morningstar. By eliminating two outliers – Lyft continues to trade below its IPO offering price and nearly 25% below its open, while Beyond Meat has surged over 540% from its offering and 240% from its open – the average return from IPO price is 62.7%, while the average return from open is only 11.1%, well short of the 17.4% returned by the S&P 500 over the first half of 2019. Thus, assuming an investor purchased equal amounts of each IPO at its open price, she would have gained nearly 34% over the first half of the year, though would need to thank Beyond Meat for over two-thirds of that performance, without which she would have underperformed the broader market significantly.
Risk Management is Crucial to Successful Investing
We believe our clients should be compensated commensurately for the investment risks they incur. Risk applies both to the upside and downside, and nearly every popular IPO of the year has seen that risk materialize to the upside. That’s not to say, however, that significant downside risk isn’t still present. At the end of the second quarter, the nine companies referenced above had market capitalizations totaling $193.6 billion, while combining for $6.2 billion in net losses according to Morningstar. This signals to us that investors are paying dearly for growth expectations, which can certainly diminish over time if profitability doesn’t improve. Should we face a recession in the near future as some anticipate, the chances of these companies breaking even are miniscule. Given this, we view it as unlikely that returns generated will offset the risks inherent in these issues, particularly after accounting for their inflated current valuations.
***
Simply put, we don’t believe the valuations attributed to the high-flying IPOs of this year are justified given their lackluster financials. We argue that a prudent investment strategy is one which doesn’t rely so heavily on the performance of one or a handful of high-flying stocks, especially when downside risks are as high as they are with these newly public companies. This aside, there is no guarantee that an investor will be able to invest in an IPO at its offering price, instead being forced to buy in at its open price, at which point the majority of upside has often already diminished. While 2019 has proven to be a lucrative year for IPO investment, clients and investors cannot count on this phenomenon to continue and would be well advised to carefully consider the risks involved in buying shares of popular companies whose prices are seemingly driven by growth expectations and excitement for their public offerings, rather than by earnings and underlying fundamentals.